class: center, middle, inverse, title-slide # Introduction to dplyr ### Kevin Stachelek ### 2019/03/06 (updated: 2019-03-01) --- # Resources .pull-left[ [R for Data Science](https://r4ds.had.co.nz/) [rstudio cheat sheets](https://www.rstudio.com/resources/cheatsheets/) ] .pull-right[  ] --- # Load Packages ```r # load 'gapminder' package containing demographic data library(gapminder) # load 'dplyr' package for manipulating data library(dplyr) ``` --- # Look at the data ```r #look at gapminder gapminder ``` ``` ## # A tibble: 1,704 x 6 ## country continent year lifeExp pop gdpPercap ## <fct> <fct> <int> <dbl> <int> <dbl> ## 1 Afghanistan Asia 1952 28.8 8425333 779. ## 2 Afghanistan Asia 1957 30.3 9240934 821. ## 3 Afghanistan Asia 1962 32.0 10267083 853. ## 4 Afghanistan Asia 1967 34.0 11537966 836. ## 5 Afghanistan Asia 1972 36.1 13079460 740. ## 6 Afghanistan Asia 1977 38.4 14880372 786. ## 7 Afghanistan Asia 1982 39.9 12881816 978. ## 8 Afghanistan Asia 1987 40.8 13867957 852. ## 9 Afghanistan Asia 1992 41.7 16317921 649. ## 10 Afghanistan Asia 1997 41.8 22227415 635. ## # ... with 1,694 more rows ``` -- ## How many observations are in the gapminder dataset? --- # The Filter Verb  -- # The Pipe 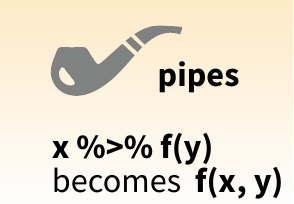 --- # Filtering ```r gapminder %>% filter(year == 2007) ``` ``` ## # A tibble: 142 x 6 ## country continent year lifeExp pop gdpPercap ## <fct> <fct> <int> <dbl> <int> <dbl> ## 1 Afghanistan Asia 2007 43.8 31889923 975. ## 2 Albania Europe 2007 76.4 3600523 5937. ## 3 Algeria Africa 2007 72.3 33333216 6223. ## 4 Angola Africa 2007 42.7 12420476 4797. ## 5 Argentina Americas 2007 75.3 40301927 12779. ## 6 Australia Oceania 2007 81.2 20434176 34435. ## 7 Austria Europe 2007 79.8 8199783 36126. ## 8 Bahrain Asia 2007 75.6 708573 29796. ## 9 Bangladesh Asia 2007 64.1 150448339 1391. ## 10 Belgium Europe 2007 79.4 10392226 33693. ## # ... with 132 more rows ``` --- # Let's Review + '%>%' is a pipe -- + '==' means 'is this equal?' (test) -- + '=' means 'set this equal' (assignment) -- ## How many rows are in the filtered data? -- <span style="font-size: 200%">142</span> --- # Filtering by string ```r gapminder %>% filter(country == "United States") ``` ``` ## # A tibble: 12 x 6 ## country continent year lifeExp pop gdpPercap ## <fct> <fct> <int> <dbl> <int> <dbl> ## 1 United States Americas 1952 68.4 157553000 13990. ## 2 United States Americas 1957 69.5 171984000 14847. ## 3 United States Americas 1962 70.2 186538000 16173. ## 4 United States Americas 1967 70.8 198712000 19530. ## 5 United States Americas 1972 71.3 209896000 21806. ## 6 United States Americas 1977 73.4 220239000 24073. ## 7 United States Americas 1982 74.6 232187835 25010. ## 8 United States Americas 1987 75.0 242803533 29884. ## 9 United States Americas 1992 76.1 256894189 32004. ## 10 United States Americas 1997 76.8 272911760 35767. ## 11 United States Americas 2002 77.3 287675526 39097. ## 12 United States Americas 2007 78.2 301139947 42952. ``` -- + It's important to use quotes around this filter --- # Filtering by Two Variables ```r gapminder %>% filter(year == 2007, country == "United States") ``` ``` ## # A tibble: 1 x 6 ## country continent year lifeExp pop gdpPercap ## <fct> <fct> <int> <dbl> <int> <dbl> ## 1 United States Americas 2007 78.2 301139947 42952. ``` -- * each statement within '()' separated by comma is called an argument --- # The Arrange verb  --- # Arrange by Variable ```r gapminder %>% arrange(gdpPercap) ``` ``` ## # A tibble: 1,704 x 6 ## country continent year lifeExp pop gdpPercap ## <fct> <fct> <int> <dbl> <int> <dbl> ## 1 Congo, Dem. Rep. Africa 2002 45.0 55379852 241. ## 2 Congo, Dem. Rep. Africa 2007 46.5 64606759 278. ## 3 Lesotho Africa 1952 42.1 748747 299. ## 4 Guinea-Bissau Africa 1952 32.5 580653 300. ## 5 Congo, Dem. Rep. Africa 1997 42.6 47798986 312. ## 6 Eritrea Africa 1952 35.9 1438760 329. ## 7 Myanmar Asia 1952 36.3 20092996 331 ## 8 Lesotho Africa 1957 45.0 813338 336. ## 9 Burundi Africa 1952 39.0 2445618 339. ## 10 Eritrea Africa 1957 38.0 1542611 344. ## # ... with 1,694 more rows ``` --- # Arrange by Variable * you can use `desc` to sort in reverse order -- ```r gapminder %>% arrange(desc(gdpPercap)) ``` ``` ## # A tibble: 1,704 x 6 ## country continent year lifeExp pop gdpPercap ## <fct> <fct> <int> <dbl> <int> <dbl> ## 1 Kuwait Asia 1957 58.0 212846 113523. ## 2 Kuwait Asia 1972 67.7 841934 109348. ## 3 Kuwait Asia 1952 55.6 160000 108382. ## 4 Kuwait Asia 1962 60.5 358266 95458. ## 5 Kuwait Asia 1967 64.6 575003 80895. ## 6 Kuwait Asia 1977 69.3 1140357 59265. ## 7 Norway Europe 2007 80.2 4627926 49357. ## 8 Kuwait Asia 2007 77.6 2505559 47307. ## 9 Singapore Asia 2007 80.0 4553009 47143. ## 10 Norway Europe 2002 79.0 4535591 44684. ## # ... with 1,694 more rows ``` --- # Filter and Arrange ```r gapminder %>% filter(year == 2007) %>% arrange(desc(gdpPercap)) ``` ``` ## # A tibble: 142 x 6 ## country continent year lifeExp pop gdpPercap ## <fct> <fct> <int> <dbl> <int> <dbl> ## 1 Norway Europe 2007 80.2 4627926 49357. ## 2 Kuwait Asia 2007 77.6 2505559 47307. ## 3 Singapore Asia 2007 80.0 4553009 47143. ## 4 United States Americas 2007 78.2 301139947 42952. ## 5 Ireland Europe 2007 78.9 4109086 40676. ## 6 Hong Kong, China Asia 2007 82.2 6980412 39725. ## 7 Switzerland Europe 2007 81.7 7554661 37506. ## 8 Netherlands Europe 2007 79.8 16570613 36798. ## 9 Canada Americas 2007 80.7 33390141 36319. ## 10 Iceland Europe 2007 81.8 301931 36181. ## # ... with 132 more rows ``` * The pipe `%>%` is useful for combining operations together --- # The Mutate Verb 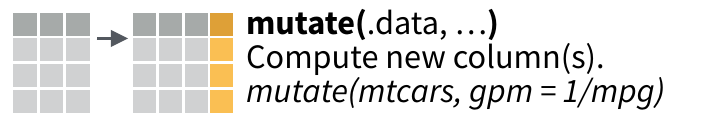 * used to add a new variable * or change a variable based on the value of another --- # Change an existing variable ```r gapminder %>% mutate(pop = pop / 1000000) ``` ``` ## # A tibble: 1,704 x 6 ## country continent year lifeExp pop gdpPercap ## <fct> <fct> <int> <dbl> <dbl> <dbl> ## 1 Afghanistan Asia 1952 28.8 8.43 779. ## 2 Afghanistan Asia 1957 30.3 9.24 821. ## 3 Afghanistan Asia 1962 32.0 10.3 853. ## 4 Afghanistan Asia 1967 34.0 11.5 836. ## 5 Afghanistan Asia 1972 36.1 13.1 740. ## 6 Afghanistan Asia 1977 38.4 14.9 786. ## 7 Afghanistan Asia 1982 39.9 12.9 978. ## 8 Afghanistan Asia 1987 40.8 13.9 852. ## 9 Afghanistan Asia 1992 41.7 16.3 649. ## 10 Afghanistan Asia 1997 41.8 22.2 635. ## # ... with 1,694 more rows ``` --- # Add a new variable ```r gapminder %>% mutate(gdp = gdpPercap * pop) ``` ``` ## # A tibble: 1,704 x 7 ## country continent year lifeExp pop gdpPercap gdp ## <fct> <fct> <int> <dbl> <int> <dbl> <dbl> ## 1 Afghanistan Asia 1952 28.8 8425333 779. 6567086330. ## 2 Afghanistan Asia 1957 30.3 9240934 821. 7585448670. ## 3 Afghanistan Asia 1962 32.0 10267083 853. 8758855797. ## 4 Afghanistan Asia 1967 34.0 11537966 836. 9648014150. ## 5 Afghanistan Asia 1972 36.1 13079460 740. 9678553274. ## 6 Afghanistan Asia 1977 38.4 14880372 786. 11697659231. ## 7 Afghanistan Asia 1982 39.9 12881816 978. 12598563401. ## 8 Afghanistan Asia 1987 40.8 13867957 852. 11820990309. ## 9 Afghanistan Asia 1992 41.7 16317921 649. 10595901589. ## 10 Afghanistan Asia 1997 41.8 22227415 635. 14121995875. ## # ... with 1,694 more rows ``` * column names need to be one word (no spaces!) --- # Combining Verbs Which countries had the highest gdp in 2007? -- ```r gapminder %>% mutate(gdp = gdpPercap * pop) %>% # create gdp column filter(year == 2007) %>% # filter by year arrange(desc(gdp)) # sort by gdp ``` ``` ## # A tibble: 142 x 7 ## country continent year lifeExp pop gdpPercap gdp ## <fct> <fct> <int> <dbl> <int> <dbl> <dbl> ## 1 United States Americas 2007 78.2 301139947 42952. 1.29e13 ## 2 China Asia 2007 73.0 1318683096 4959. 6.54e12 ## 3 Japan Asia 2007 82.6 127467972 31656. 4.04e12 ## 4 India Asia 2007 64.7 1110396331 2452. 2.72e12 ## 5 Germany Europe 2007 79.4 82400996 32170. 2.65e12 ## 6 United Kingdom Europe 2007 79.4 60776238 33203. 2.02e12 ## 7 France Europe 2007 80.7 61083916 30470. 1.86e12 ## 8 Brazil Americas 2007 72.4 190010647 9066. 1.72e12 ## 9 Italy Europe 2007 80.5 58147733 28570. 1.66e12 ## 10 Mexico Americas 2007 76.2 108700891 11978. 1.30e12 ## # ... with 132 more rows ``` --- # The Summarize verb  --- ### What is the average life expectancy across all countries and years? -- ```r gapminder %>% summarize(meanLifeExp = mean(lifeExp)) ``` ``` ## # A tibble: 1 x 1 ## meanLifeExp ## <dbl> ## 1 59.5 ``` --- ### What is the average life expectancy across all countries in 2007? -- ### combine with `filter`! -- ```r gapminder %>% filter(year == 2007) %>% summarize(meanLifeExp = mean(lifeExp)) ``` ``` ## # A tibble: 1 x 1 ## meanLifeExp ## <dbl> ## 1 67.0 ``` --- ### What is the average life expectancy and total population across all countries in 2007? -- ### add another summary using a different function, `sum` -- ```r gapminder %>% filter(year == 2007) %>% summarize(meanLifeExp = mean(lifeExp), * totalPop = sum(pop)) ``` ``` ## # A tibble: 1 x 2 ## meanLifeExp totalPop ## <dbl> <int> ## 1 67.0 NA ``` --- # Functions you can use for summarizing `mean` `sum` `median` `min` `max` --- # The group_by verb What is the average life expectancy and total population across all countries in each year? -- How do we tell R to __iterate__ by year? -- Use `group_by`! -- 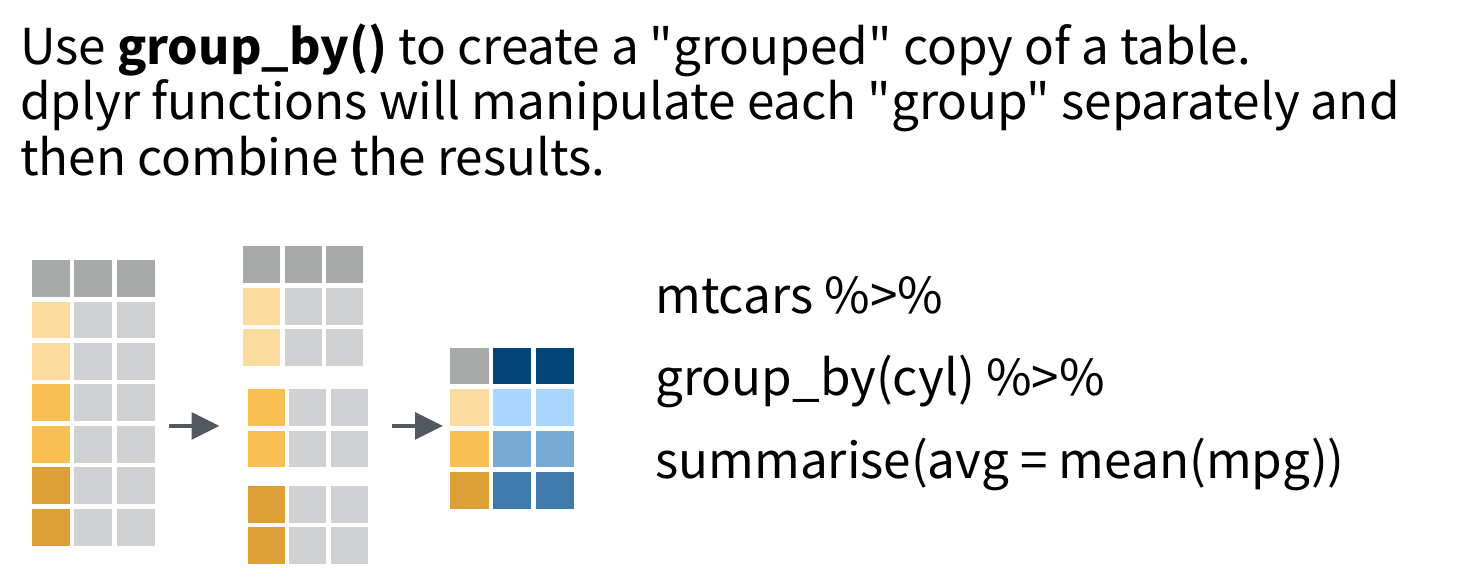 --- ```r gapminder %>% * group_by(year) %>% summarize(meanLifeExp = mean(lifeExp), totalPop = sum(pop)) ``` ``` ## # A tibble: 12 x 3 ## year meanLifeExp totalPop ## <int> <dbl> <int> ## 1 1952 49.1 NA ## 2 1957 51.5 NA ## 3 1962 53.6 NA ## 4 1967 55.7 NA ## 5 1972 57.6 NA ## 6 1977 59.6 NA ## 7 1982 61.5 NA ## 8 1987 63.2 NA ## 9 1992 64.2 NA ## 10 1997 65.0 NA ## 11 2002 65.7 NA ## 12 2007 67.0 NA ``` --- What is the average life expectancy and total population __for each continent__ across all years? -- ```r gapminder %>% * group_by(continent) %>% summarize(meanLifeExp = mean(lifeExp), totalPop = sum(pop)) ``` ``` ## # A tibble: 5 x 3 ## continent meanLifeExp totalPop ## <fct> <dbl> <int> ## 1 Africa 48.9 NA ## 2 Americas 64.7 NA ## 3 Asia 60.1 NA ## 4 Europe 71.9 NA ## 5 Oceania 74.3 212992136 ``` --- What is the average life expectancy and total population for each continent __for each year__? -- ```r gapminder %>% * group_by(year, continent) %>% summarize(meanLifeExp = mean(lifeExp), totalPop = sum(pop)) ``` ``` ## # A tibble: 60 x 4 ## # Groups: year [?] ## year continent meanLifeExp totalPop ## <int> <fct> <dbl> <int> ## 1 1952 Africa 39.1 237640501 ## 2 1952 Americas 53.3 345152446 ## 3 1952 Asia 46.3 1395357351 ## 4 1952 Europe 64.4 418120846 ## 5 1952 Oceania 69.3 10686006 ## 6 1957 Africa 41.3 264837738 ## 7 1957 Americas 56.0 386953916 ## 8 1957 Asia 49.3 1562780599 ## 9 1957 Europe 66.7 437890351 ## 10 1957 Oceania 70.3 11941976 ## # ... with 50 more rows ```