class: center, middle, inverse, title-slide # Single Cell Analysis and Visualization ### Kevin Stachelek ### 2019/04/17 (updated: 2019-04-16) --- ### Learning Resources (links) [Hemberg Lab RNAseq course](https://hemberg-lab.github.io/scRNA.seq.course/index.html) [Seurat Vignettes](https://satijalab.org/seurat/get_started.html) [Introduction to Bioconductor](http://osca.bioconductor.org/introduction.html) --- ### Imagine (fantasize) that you have single cell data <img src="img/pipeline_diagram.png" height="400" style="display: block; margin: auto;" /> -- #### What do you (and your labmates) do next? --- ### How I manage single cell data in the lab + Use [rstudio-server](https://www.rstudio.com/products/rstudio/download-server/) via the web browser -- + ssh connect in a terminal -- + Use [JupyterLab](https://jupyterlab.readthedocs.io/en/stable/getting_started/overview.html) in the browser (python) -- + Use a graphical user interface (gui) that manages an sftp connection: 1. Cyberduck (Mac) 2. filezilla (Mac/Windows) 3. PuTTY (Windows) -- + Use 'Shiny' Web Apps --- ### A Naive and Very (Imperfect) Approach -- ### Analysis Pipeline <img src="img/single_cell_pipeline_flowchart.png" width="300" height="450" /> --- ### Plot hierarchical clustering <img src="img/Capture.PNG" width="900" style="display: block; margin: auto;" /> --- ### Calculate Principle Components <style> #wrap { width: 900px; height: 1000px; padding: 0; overflow: hidden; } #frame { width: 800px; height: 700px; border: 0px solid black; } #frame { -ms-zoom: 0.75; -moz-transform: scale(0.75); -moz-transform-origin: 0 0; -o-transform: scale(0.75); -o-transform-origin: 0 0; -webkit-transform: scale(0.75); -webkit-transform-origin: 0 0; } </style> <div id="wrap"> <iframe id="frame" frameborder="0" scrolling="no" src="img/Plot_1.html"></iframe> </div> --- ### Plot Trajectory <iframe width="900" height="750" frameborder="0" scrolling="no" src="img/shRB_cluster_colors2.html"></iframe> --- ### Calculate Pseudotime <iframe width="900" height="750" frameborder="0" scrolling="no" src="img/PT_shRB_shCtrl2.html"></iframe> --- ### Find Genes Correlated with Pseudotime <img src="img/spearman_corr_1.PNG" width="900px" /><img src="img/spearman_corr_2.PNG" width="900px" /> --- ### Why did this not work well? -- + Normalization -- + Batch Effects -- + Incomplete Dimensional Reduction -- + Naive Clustering Approach --- ### The Next Generation: Seurat #### What is Seurat? Seurat is an R package designed for QC, analysis, and exploration of single-cell RNA-seq data. Written in R so fits easily into existing analysis --- ### What are the major parts of Seurat? -- ### Dimensional Reduction by PCA <img src="img/pca.gif" height="400" /> --- ### Graph Construction and Clustering <img src="img/phenograph.jpg" height="400" style="display: block; margin: auto;" /> --- ### Further Dimensional Reduction #### Several Techniques: most common is tSNE or UMAP <img src="img/tsne_v_umap.gif" width="960" height="480" /> --- ### Seurat Advantages: 1. Batch Correction aka 'integration'. 2. Label Transfer across experiments 3. Normalization --- ### Batch Correction aka integration. Seurat v3 implements methods to identify ‘anchors’ across diverse single-cell data types to construct harmonized references, or to transfer information across experiments. Stuart, Butler, Hoffman, Hafemeister, Papalexi, Mauck, Stoeckius, Smibert, and Satija (2018) <img src="img/stuart_integration_diagram.png" width="900" /> --- ### Label Transfer across experiments We can use the same batch correction technique to predict the cluster that a cell from a 'query' dataset would fall into in a reference dataset. Useful for comparison to published studies --- ### Normalization Seurat v3 includes sctransform, a new modeling approach for the normalization of single-cell data. Compared to standard log-normalization, sctransform effectively removes technically-driven variation while preserving biological heterogeneity. Hafemeister and Satija (2019) --- ### Some other Approaches to Single Cell Transcriptome Analysis 1. [Scanpy](https://scanpy.readthedocs.io/en/latest/) 2. [bigScale 2](https://github.com/iaconogi/bigSCale2) 3. [Bioconductor](https://osca.bioconductor.org/) + includes a lot more than just scRNAseq --- ### [Scanpy](https://scanpy.readthedocs.io/en/latest/) Strengths and Weaknesses 1. Speed 2. Pseudotime Integration - PAGA 3. Makes several machine learning approaches easier to use + Denoising Auto Encoder Eraslan, Simon, Mircea, Mueller, and Theis (2019) + Integrating Datasets (Batch Correction) using Machine Learning Lotfollahi, Wolf, and Theis (2018) + Transfer Learning Lotfollahi, Wolf, and Theis (2018) --- ### [bigScale 2](https://github.com/iaconogi/bigSCale2) disclaimer: I haven't tried this sofware; and haven't yet gotten a sense of popularity -- + Sensitive and accurate marker detection and classification. No method is used to reduce dimensions, all information is retained. + Infer gene regulatory networks for any single cell dataset. + Compress large datasets of any size into a smaller datasets of higher quality, without loss of information. + Reduce a dataset of many cells to one with fewers cells of increased quality --- ### [Bioconductor](https://osca.bioconductor.org/) Bioconductor is a repository of R packages which focuses on software tailored for genomic analysis. (Think of it as CRAN for bioinformatics) Bioconductor has strict requirements for a package to be accepted into the repository. there is also a focus on high quality documentation and the use of common data infrastructure to promote package interoperability. --- ### Seurat works well! Why Bioconductor? 1. Seurat is written and designed with similar principles to bioconductor. We can better understand Seurat if we get a good grasp of bioconductor. -- 2. We can extend our analysis to other domains (genomics/epigenomics) with a solid understanding of bioconductor. -- 3. We can interact with public data and annotation: + Gene Expression Omnibus (GEO) + Sequence Read Archive (SRA) + Annotation-- Refseq, ensembl, gencode --- ### Installing Bioconductor Packages To install Bioconductor packages, we first need the BiocManager package which is hosted on CRAN. This can be installed by running: The BiocManager package makes it easy to install packages from the Bioconductor repository. For example, to install the SingleCellExperiment package, we run: --- ### Digression: Getting Help One of the most important R skills is knowing how to get help. -- The most reliable place to look is inside R! -- To get the manual associated with a function, class, dataset, or package, you can prepend the code of interest with a ? to retrieve the relevant help page. For example, to get information about the data.frame() function, the SingleCellExperiment class, the in-built iris dataset, or for the BiocManager package, you can type: ```r ?data.frame ?SingleCellExperiment ?iris ?BiocManager ``` --- ### the `SingleCellExperiment` object The motivation: RNA sequencing data consists of three major parts: 1. The expression data (counts) + usually expressed in a matrix of features (genes or transcripts) by row and cells by column. -- 2. The cell-level information (colData) -- 3. The feature-level information (featureData) -- __It can be a pain to keep track of this in many separate objects__ So we use a specialized object from the Bioconductor ecosystem, the `SingleCellExperiment` --- ### Single Cell Experiment 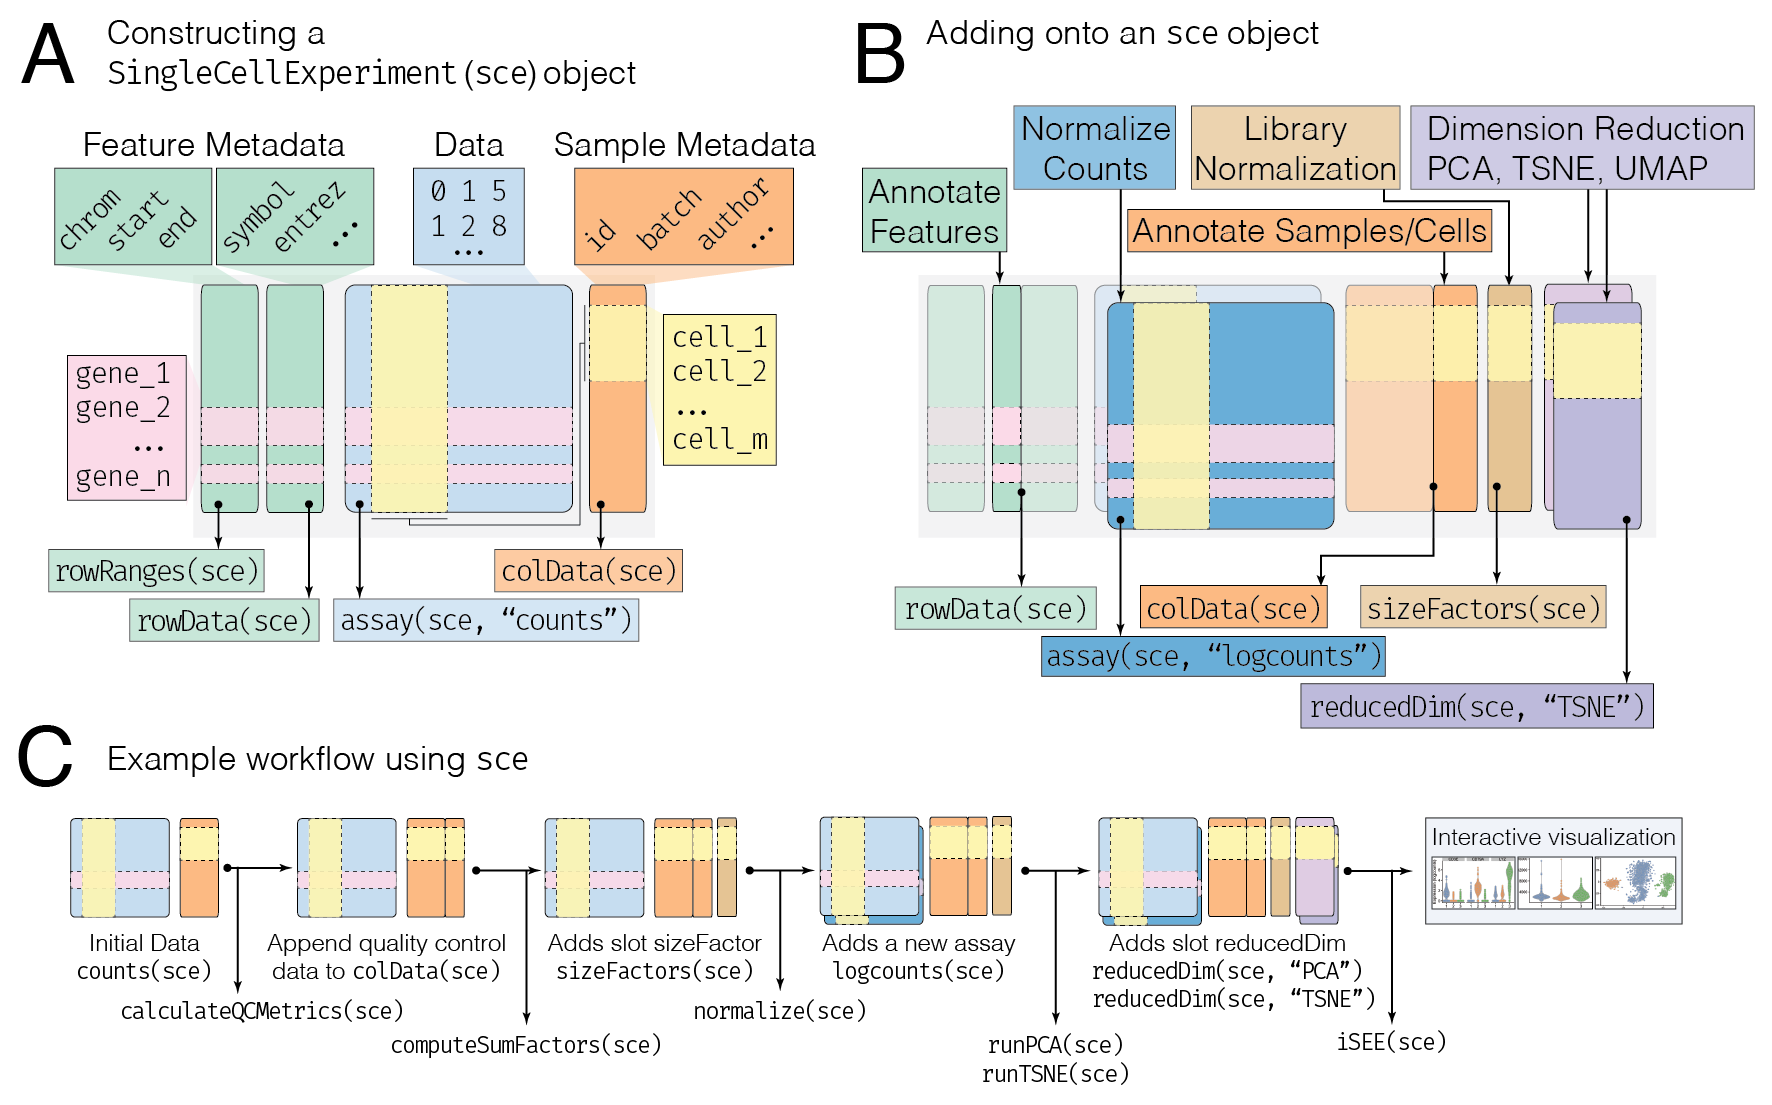 --- ### So many tools! <blockquote class="twitter-tweet" data-lang="en"><p lang="en" dir="ltr">Too many awesome new datasets, biological findings, ML methods every second of every day. And they are spawning too many new ideas. I luv science & I'm going crazy (in a good way) that I can't keep up with all the coolness and just have one brain and two hands and no time. Fk!!!!</p>— ANSHUL KUNDAJE (@anshulkundaje) <a href="https://twitter.com/anshulkundaje/status/1116398619072942080?ref_src=twsrc%5Etfw">April 11, 2019</a></blockquote> <script async src="https://platform.twitter.com/widgets.js" charset="utf-8"></script> -- ### What's the most efficient way to pursue your (biological) questions? --- ### Step 1: Data Science for all .pull-left[ <span style="font-size: 200%">[R for Data Science](https://r4ds.had.co.nz/)</span> <span style="font-size: 200%">[rstudio cheat sheets](https://www.rstudio.com/resources/cheatsheets/)</span> ] .pull-right[ <!-- --> ] --- ### Step 2: Graphical User Interfaces(GUIs) for some #### scRNA Visualization Tools 1. [scClustViz](https://baderlab.github.io/scClustViz/) 2. [iSEE](https://bioconductor.org/packages/release/bioc/html/iSEE.html) --- ### scClustViz [Developmental Emergence of Adult Neural Stem Cells as Revealed by Single-Cell Transcriptional Profiling](https://innesbt.shinyapps.io/scclustvizdemoapp/) --- ### iSEE 1. [a small single-cell RNA-seq dataset from the mouse visual cortex](https://marionilab.cruk.cam.ac.uk/iSEE_allen/) 2. [The Cancer Genome Atlas RNA-seq dataset](https://marionilab.cruk.cam.ac.uk/iSEE_tcga/) 3. [a droplet-based single-cell RNA-seq dataset involving peripheral blood mononuclear cells](https://marionilab.cruk.cam.ac.uk/iSEE_pbmc4k/) 4. [a mass cytometry dataset from healthy and diseased human donors](https://marionilab.cruk.cam.ac.uk/iSEE_cytof/) --- ### Or make your own with Shiny and Plotly! Seurat outputs ggplot objects from all its plotting functions The `plotly` R package can turn these into interactive `plotly` plots Shiny is an R package that makes it easy to build interactive web apps straight from R. You can then display these plots in your own custom shiny app --- ### References Eraslan, G, L. M. Simon, M. Mircea, et al. (2019). "Single-cell RNA-seq denoising using a deep count autoencoder". En. In: _Nature Communications_ 10.1, p. 390. ISSN: 2041-1723. DOI: [10.1038/s41467-018-07931-2](https://doi.org/10.1038%2Fs41467-018-07931-2). URL: [https://www.nature.com/articles/s41467-018-07931-2](https://www.nature.com/articles/s41467-018-07931-2) (visited on Apr. 11, 2019). Hafemeister, C. and R. Satija (2019). "Normalization and variance stabilization of single-cell RNA-seq data using regularized negative binomial regression". En. In: _bioRxiv_, p. 576827. DOI: [10.1101/576827](https://doi.org/10.1101%2F576827). URL: [https://www.biorxiv.org/content/10.1101/576827v2](https://www.biorxiv.org/content/10.1101/576827v2) (visited on Apr. 11, 2019). Lotfollahi, M, F. A. Wolf, and F. J. Theis (2018). "Generative modeling and latent space arithmetics predict single-cell perturbation response across cell types, studies and species". En. In: _bioRxiv_, p. 478503. DOI: [10.1101/478503](https://doi.org/10.1101%2F478503). URL: [https://www.biorxiv.org/content/10.1101/478503v2](https://www.biorxiv.org/content/10.1101/478503v2) (visited on Apr. 11, 2019). Stuart, T., A. Butler, P. Hoffman, et al. (2018). _Comprehensive integration of single cell data_. En. preprint. Genomics. DOI: [10.1101/460147](https://doi.org/10.1101%2F460147). URL: [http://biorxiv.org/lookup/doi/10.1101/460147](http://biorxiv.org/lookup/doi/10.1101/460147) (visited on Apr. 11, 2019).